In a microservices architecture, it is common to have multiple services communicating with each other over the network. This distributed nature of the architecture can make it challenging to diagnose and debug issues when they arise. To address this problem, developers often use monitoring(Micrometer) and tracing tools(Zipkin) to track the flow of requests between microservices.
In this tutorial, you will learn how to trace HTTP requests using Micrometer and Zipkin.
What is Zipkin?
Zipkin is a tool that helps developers trace requests across different parts of a distributed system. Think of it as a way to see the path a request takes as it moves between different microservices. This can be really useful for understanding how long it takes for requests to be processed, where bottlenecks are, and what might be causing problems. With Zipkin, developers can quickly figure out what’s going on when things go wrong and work to optimize their systems.
Using Zipkin is straightforward: the tool collects data from the different parts of the system and then displays it in a user-friendly way. This makes it easy to see what’s happening with requests and pinpoint where things might be slowing down. Zipkin works with different programming languages and frameworks and can integrate with other tools like Prometheus and Grafana. By using Zipkin, developers can gain a better understanding of how their distributed systems are performing and make improvements to ensure they’re running smoothly.
Starting up Zipkin
Starting up Zipkin is easy! First, make sure you have Docker installed on your computer. Then, open up your terminal and enter the following command:
docker run -p 9411:9411 openzipkin/zipkin:latest
This command tells Docker to download the latest version of Zipkin and start it up on your computer. You should see some output in your terminal as Docker sets everything up.
Once Zipkin is up and running, you can open up your web browser and go to http://localhost:9411/zipkin/. This will take you to the Zipkin web interface, where you can start exploring your traces and understanding how your microservices are interacting with each other.
And that’s it! With just a few simple commands, you can start using Zipkin to monitor and debug your microservices.
No traces in Zipkin?
After starting up Zipkin using the Docker command I have mentioned, you may notice that there are no traces visible in the web interface. That’s because Zipkin only displays traces that have been generated by your microservices.
To see traces in Zipkin, you’ll need to set up your microservice application to use Micrometer. Once your application is configured to use Micrometer, you can start generating HTTP requests between your microservices. As these requests are made, Zipkin will start collecting data and displaying it in the form of traces.
So don’t worry if you don’t see any traces at first!
What is Micrometer?
Micrometer is a tool that helps developers keep track of how their microservices are performing. It does this by collecting and displaying data about things like response times, errors, and how many requests are being made. Think of it like a dashboard for a car – it gives you a quick way to see what’s going on and lets you know if anything needs attention.
By using Micrometer, developers can gain insights into the performance of their microservices and make informed decisions about optimizing their systems. The library enables easy tracking of custom metrics, giving developers greater control over monitoring specific aspects of their application’s performance.
Adding Micrometer to Spring Boot 3 Application
1. Add Micrometer Maven Dependencies
To add Micrometer to your Spring Boot application, you’ll need to include a few additional dependencies in your project. These dependencies are what allow Micrometer to collect and display data about your application’s performance.
<dependency>
    <groupId>io.micrometer</groupId>
    <artifactId>micrometer-observation</artifactId>
</dependency>
<dependency>
    <groupId>io.micrometer</groupId>
    <artifactId>micrometer-tracing-bridge-brave</artifactId>
</dependency>
<dependency>
    <groupId>io.zipkin.reporter2</groupId>
    <artifactId>zipkin-reporter-brave</artifactId>
</dependency>
- The micrometer-observation maven dependency is responsible for making Observations, which are a way of measuring and recording metrics in a Spring Boot application. Observations are a core concept of Micrometer, which is a simple facade over the instrumentation clients for a number of popular monitoring systems. By using the micrometer-observation dependency, you can collect and report metrics from your application to various monitoring backends.
- The micrometer-tracing-bridge-brave dependency is used for tracing your Spring Boot application. Tracing is a way of seeing what happened and how long it took to happen in your application, such as when a web request is made or a database is accessed. Tracing helps you to debug and optimize your application performance. The micrometer-tracing-bridge-brave dependency pulls in the Micrometer Tracing facade along with glue code to use Brave, the tracing solution from the Zipkin team. By using the micrometer-tracing-bridge-brave dependency, you can integrate your application with Zipkin and see the traces in a web UI.
The difference between the micrometer-observation and the micrometer-tracing-bridge-brave dependencies is that the former is for metrics, and the latter is for tracing. Metrics are numerical measurements that show the state or behaviour of your application, such as the number of requests, the response time, the memory usage, etc. Tracing is a way of tracking the flow of requests and operations across your application, such as the path, the duration, the errors, the dependencies, etc. Metrics and tracing are both important aspects of observability, which is the ability to monitor and understand your application’s performance and behaviour. By using both dependencies, you can get a comprehensive view of your application’s health and performance. - The zipkin-reporter-brave dependency is used for sending the traces that you collect with the micrometer-tracing-bridge-brave dependency to the Zipkin backend.
2. Add Spring Boot Actuator Dependency
To use Micrometer with your Spring Boot application, you’ll need to add a dependency called “spring-boot-starter-actuator”. This dependency provides a range of monitoring and management features for your microservices, such as the ability to expose metrics and health information.
To add the “spring-boot-starter-actuator” dependency to your project, simply include the following line in your pom.xml file:
<dependency>
  <groupId>org.springframework.boot</groupId>
  <artifactId>spring-boot-starter-actuator</artifactId>
</dependency>
Once you’ve added this dependency, Micrometer will be able to collect and display data about your microservices’ performance. So make sure you include this dependency in your project if you’re planning to use Micrometer!
3. Configure Tracing Sampling Probability
To ensure that Micrometer traces every action in your microservice application, you’ll need to configure it in the application.properties file. This can be done by adding the following property:
management.tracing.sampling.probability=1.0
By default, Micrometer only traces a fraction of the time, or 10% by default (0.1 probability). This is to reduce the amount of data collected and processed, which can be beneficial in certain cases. However, if you want to trace every action in your application, you can set the probability to 1.0. Setting the probability to 1.0 is helpful for testing, debugging, or analyzing your application in detail. However, before deploying your application to a production environment, you might want to reduce this value.
This property configures the sampling probability for Micrometer’s tracing functionality. Essentially, it determines the likelihood that a given request or action will be traced. A probability of 1.0 means that every action will be traced, while a probability of 0.5 means that only half of the actions will be traced, and so on. A default value is 0.1, which means that only one out of ten requests will be traced.
So, make sure to add this property to your application.properties file if you want to trace every action in your microservice application.
Tracing HTTP Request Sent with Rest Template
To trace HTTP request that was sent with RestTemplate, you will need to create an instance of a RestTemplate using the RestTemplateBuilder.
@Bean
public RestTemplate getRestTemplate(RestTemplateBuilder builder)
{
    return builder.build();
}
The code example above creates an instance of RestTemplate using the RestTemplateBuilder.
- RestTemplate is a Java class that allows you to make HTTP requests to a web server and retrieve the response.
- RestTemplateBuilder is a helper class that provides convenient methods for configuring and building RestTemplate instances.
The good news is that there is no additional configuration you need to do for tracing to start working.
You can then inject an instance of RestTemplate into your @RestController or @Service class and send HTTP request as usual.
RestTemplate restTemplate;
...

String albumsUrl = String.format(environment.getProperty("albums.url"), userId);
ResponseEntity<List<AlbumResponseModel>> albumsListResponse = restTemplate.exchange(albumsUrl, HttpMethod.GET, null, new ParameterizedTypeReference<List<AlbumResponseModel>>() { });
List<AlbumResponseModel> albumsList = albumsListResponse.getBody();

..
Tracing HTTP Request Sent with Feign
If you’re using OpenFeign to send HTTP requests in your Spring Boot 3 application, and you also want to use Micrometer for monitoring, then you’ll need to create a MicrometerCapability bean. Otherwise, a new TraceId will be generated for every SpanId, which can cause issues. So, it’s important to add the following code to a @Configuration class in your Spring Boot 3 application to avoid this problem. However, note that this requirement may change in the future.
feign-micrometer Maven Dependency
To create a MicrometerCapability bean, you will first need to add the following dependency:
<!-- https://mvnrepository.com/artifact/io.github.openfeign/feign-micrometer -->
<dependency>
    <groupId>io.github.openfeign</groupId>
    <artifactId>feign-micrometer</artifactId>
</dependency>
MicrometerCapability bean
Now that you have a maven dependency, you can create a MicrometerCapability bean.
@Bean
public Capability capability(final MeterRegistry registry) {
    return new MicrometerCapability(registry);
}
Once you have the following bean created, use Feign to send HTTP requests as usual. There is no other special configuration you need to make.
To learn how to use Feign to send HTTP requests, please read the following tutorial: Feign Client to call another microservice.
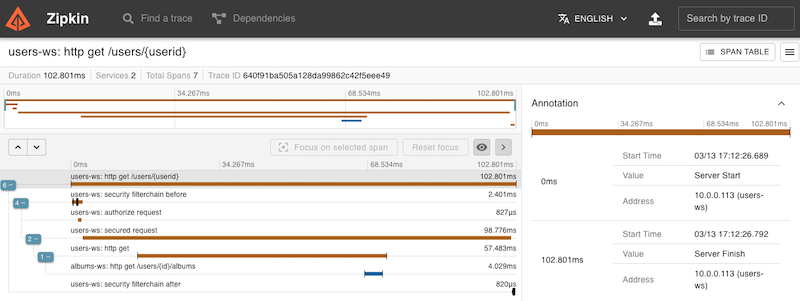
Once tracing starts working, you will will be able to inspect the flow of HTTP requests in Zipkin.
Display TraceId and SpanId in a log file
To make TraceId and SpanId display in a log file, add the following configuration to the application.properties file.
logging.pattern.level=%5p [${spring.application.name:},%X{traceId:-},%X{spanId:-}]
The logging.pattern.level property is used to customize the way logging works in Spring Boot applications. When we add the property with the value %5p [${spring.application.name:},%X{traceId:-},%X{spanId:-}] to the application.properties file, it adds some extra information to the logs.
Specifically, it includes the name of the application, the trace ID, and the span ID. The trace ID is like a unique ID for a request that goes through multiple parts of the system, while the span ID is a unique ID for a single action within that request. By adding this extra information to the logs, it makes it easier to track down problems and see how requests are moving through different parts of the system.
To get the trace ID and span ID, the system uses something called the Mapped Diagnostic Context, or MDC for short. This is a way of keeping track of information about a particular request as it moves through the system. The system uses a tool called Spring Cloud Sleuth to add the trace ID and span ID to the MDC.
Enable Logging DEBUG Level
You can also enable DEBUG mode for your application to see more logging details:
logging.level.org.springframework.web = DEBUG
Enable Debug level for specific class only
Alternatively, you can enable logging DEBUG level only for a class that is used to log information. For example, in my application the methods in the UsersServiceImpl class log information to a log file. To enable DEBUG level for this class only, I will add the following configuration property to application.properties file.
logging.level.com.appsdeveloperblog.photoapp.api.users.service.UsersServiceImpl=DEBUG
Final words
I hope this tutorial helped you configure your Spring Boot 3 application to work with Micrometer and Zipkin. If you are interested to learn more about Spring Cloud, please check out other Spring Cloud tutorials.